The Index
London's Great Smog of 1952: Why the Fog Turned Deadly
What caused London's Great Smog in December 1952? Learn how weather trapped pollution and why estimates of 4,000 and 12,000 deaths cover different periods.
Topics: Great Smog, London, 1952, Environmental History
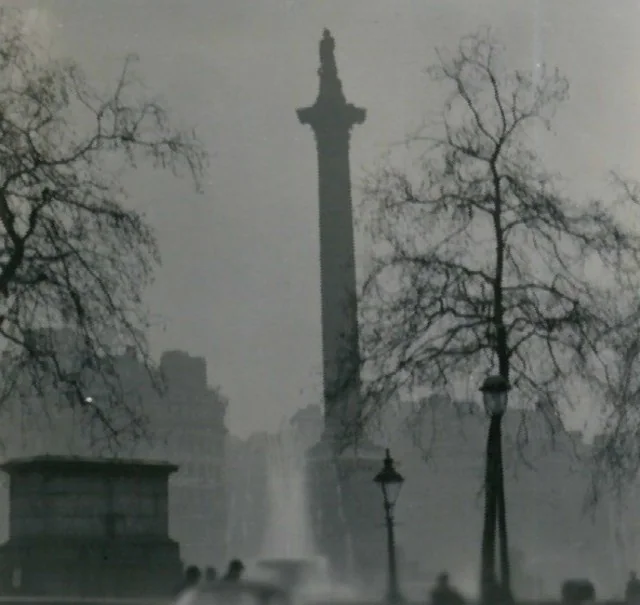
London’s Great Smog lasted from 5 to 9 December 1952, when polluted air accumulated under weather conditions that prevented it from dispersing. The visible fog lifted, but the human consequences continued. An early figure of roughly 4,000 deaths and a later estimate of about 12,000 refer to different assessments and time windows.
The disaster was not simply an unusually gloomy week. It exposed how ordinary fuel use could become lethal when emissions and weather combined.
What caused the Great Smog?
The Met Office’s case study describes a cold period, widespread coal burning, weak air movement and an anticyclone. A temperature inversion restricted the upward mixing that would normally help disperse pollution.
The important relationship is between production and removal. Smoke continued entering the air while the atmosphere was poor at carrying it away. The result was a concentrated mixture of fog and pollution near the ground.
Cold weather also increased demand for heating. This made the episode a problem of daily necessities as well as industrial emissions: households trying to stay warm contributed to a polluted atmosphere shared across the city.
What happened on the streets and inside homes?
London Museum’s history describes severely reduced visibility, disrupted buses, abandoned cars and smoke entering buildings. The smog did not respect the boundary between an outdoor street and an indoor room.
That makes the familiar photographs incomplete in an important way. They show how little people could see, but they cannot show the full health impact of the air they were breathing. A dramatic silhouette of a monument records visibility, not exposure for every person around it.
The photograph above was taken during the 1952 episode. The Monet painting later in this article is much earlier and illustrates London’s longstanding visual association with fog; it is not a picture of this particular disaster.
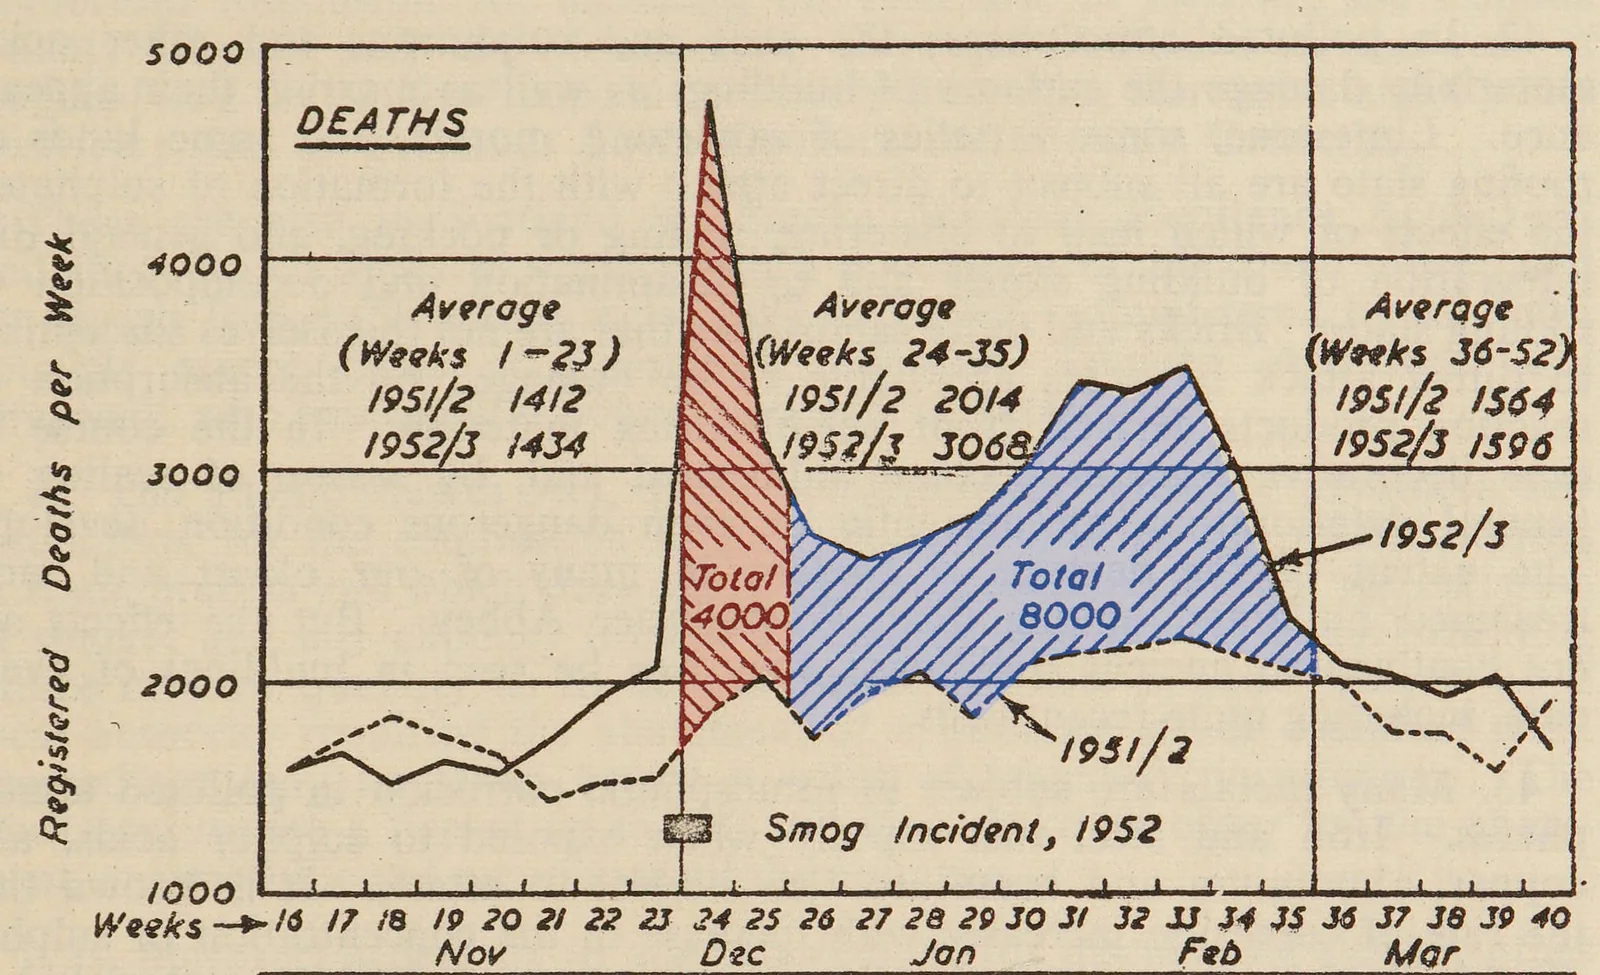
A contemporary mortality chart showing the rise around the smog and its aftermath; it is not a count of deaths only during five days. Source. Great Britain Committee on Air Pollution. Public domain. Resized and converted to WebP.
Did 4,000 or 12,000 people die?
Both figures appear because the counting problem extends beyond the five visible days. Around 4,000 is commonly used for the immediate toll. Michelle Bell and Devra Davis’s 2001 reassessment estimated approximately 12,000 excess deaths from December 1952 through February 1953.
Their study compared mortality and other indicators with earlier periods and rejected the claim that influenza fully accounted for the continuing rise. The larger estimate concerns acute and persisting effects across those months. It should not be rewritten as a direct count of 12,000 deaths during the five days alone.
| Figure | How to read it |
|---|---|
| About 4,000 | The frequently cited immediate toll |
| About 12,000 | A later estimate covering December 1952–February 1953 |
| Five days | The duration of the principal visible smog episode |
Excess deaths means deaths above an expected comparison level. It is a statistical estimate, not a list in which every individual death certificate names the same cause. That does not make the estimate unimportant; it explains what question the researchers were answering.
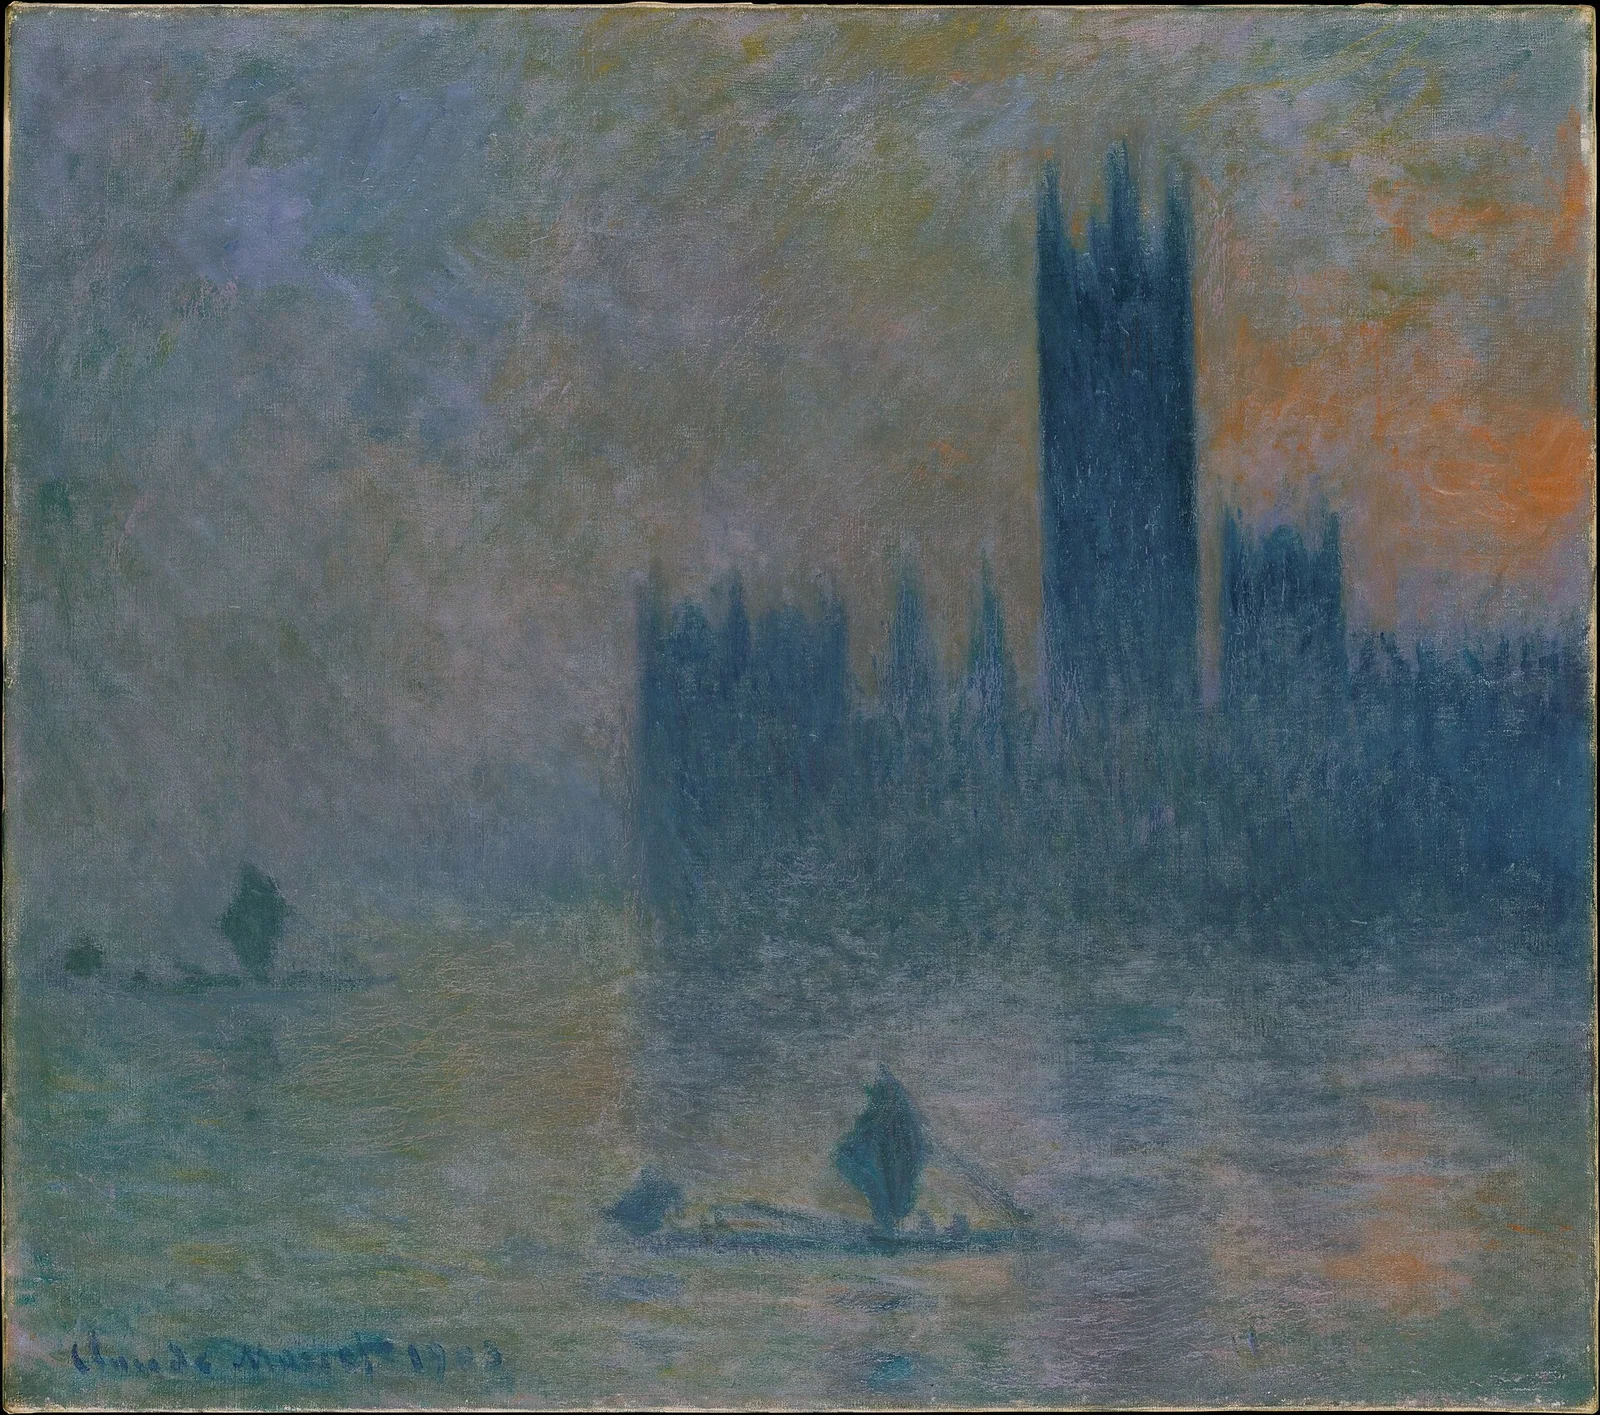
Claude Monet’s earlier Houses of Parliament painting illustrates London’s visual association with fog, not the 1952 event. Source. Claude Monet. CC0. Resized and converted to WebP.
What changed afterward?
The disaster helped drive the response represented by the Clean Air Act 1956. London Museum places the legislation in the aftermath of the smog and the public pressure for cleaner air. The Act’s date also shows that the political response was not completed the moment the fog cleared.
It would be misleading to describe the episode as the instant end of air pollution. The history is one of recognition, regulation and changes over time, rather than one catastrophic week followed by permanently clean skies. For a coal disaster that unfolded underground rather than in the air, see our guide to the Centralia mine fire, burning beneath a Pennsylvania town since 1962.
Why does the story still get simplified?
Fog offers an unusually visible image for a hazard that can be less obvious. Photographs make the event easy to remember, while the longer mortality window is harder to fit into a caption. The same pressure encourages a single rounded death toll without its method or dates.
Reading the weather account beside the mortality study preserves both parts: how the polluted air accumulated, and why its consequences outlasted its appearance. Our guide to London’s Great Plague and the fire myth examines another disaster whose popular ending is neater than the evidence. The Franklin expedition offers a different example of why one vivid explanation rarely accounts for every death.